-
[혼공분석] 5주차_코딩은 40대 후반부터~카테고리 없음 2025. 1. 31. 18:26
[ 기본 숙제(필수) ]
1. p. 314의 손코딩(맷플롯립에서 bar()함수로 막대 그래프 그리기)을 코랩에서 그래프 출력하고 화면 캡처하기
① matplotlib 라이브러리를 활용, 데이터프레임으로 그래프 결과 확인하고/출력하여 tistory에도 삽입/완료!
[ 나만의 숙제(필수) ] ② seaborn, ③ plotly 라이브러리를 활용, 동일한 데이터프레임으로 동일한 그래프 결과/출력
① matplotlib
import matplotlib.pyplot as plt

plt.bar(count_by_subject.index, count_by_subject.values)
plt.title('Books by subject')
plt.xlabel('subject')
plt.ylabel('number of books')
for idx, val in count_by_subject.items():
  plt.annotate(val, (idx, val), xytext=(0, 2), textcoords='offset points')
plt.show()
② seaborn
import seaborn as sns

fig = sns.barplot(x=count_by_subject.index,y=count_by_subject.values)
fig.bar_label(fig.containers[0], fontsize=10);
fig.set_title('Book of subject')
fig.set_xlabel('subject')
fig.set_ylabel('number of books')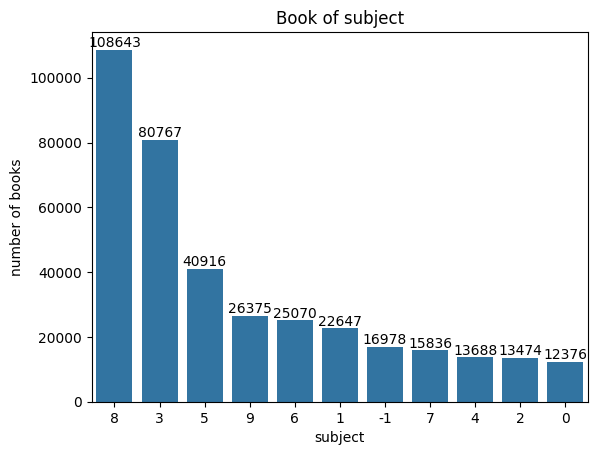
③ plotly
import plotly.express as px

fig = px.bar(count_by_subject, x=count_by_subject.index, y=count_by_subject.values, text=count_by_subject.values)
fig.update_layout(title='Book of subject', xaxis_title='subject', yaxis_title='number of books', width=600, template='plotly_dark')
fig.update_layout(
                 title_x = 0.5,
                 title_y = 0.9,
                 title_xanchor = "center",
                 title_yanchor = "middle")
fig.update_traces(texttemplate='%{text:.2s}', textposition='outside')
fig.show()
[ 추가 숙제(필수) ]
1. p. 316의 손코딩(텍스트 정렬, 막대 조절 및 색상 바꾸기)을 코랩에서 출력하고 화면 캡처하기
① matplotlib
- plt.bar(width=0.7), plt.annotate(ha='center', color='green') 추가하여 막대 조절, 텍스트 정렬 및 색상 바꾸기 완성
import matplotlib.pyplot as plt

plt.bar(count_by_subject.index, count_by_subject.values, width=0.7, color='blue')
plt.title('Books by subject')
plt.xlabel('subject')
plt.ylabel('number of books')
for idx, val in count_by_subject.items():
  plt.annotate(val, (idx, val), xytext=(0, 2), textcoords='offset points', fontsize=8, ha='center', color='green')
plt.show()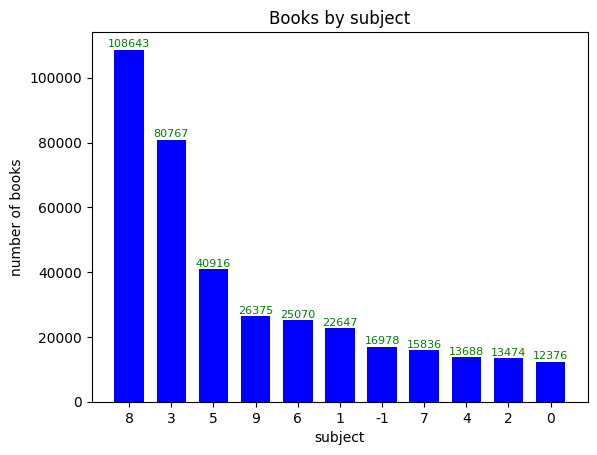
② seaborn
- sns.barplot(width=0.7), fig.bar_label(color='green') 추가하여 막대 조절, 텍스트 색상 바꾸기 완성(정렬은 기본?)
import seaborn as sns

fig = sns.barplot(x=count_by_subject.index,y=count_by_subject.values, width=0.7, color='blue')
fig.bar_label(fig.containers[0], fontsize=10, color='green');
fig.set_title('Book of subject')
fig.set_xlabel('subject')
fig.set_ylabel('number of books')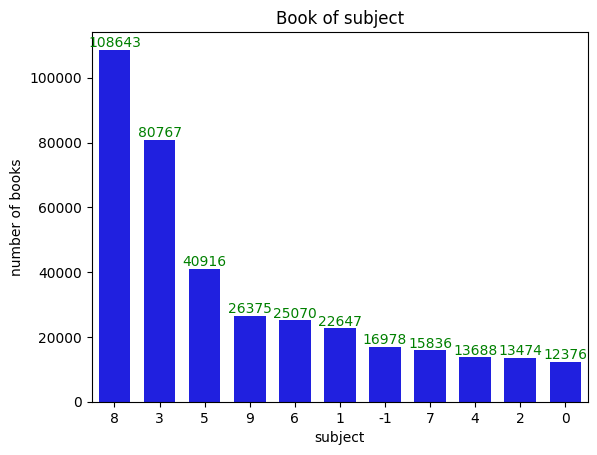
③ plotly
- fig.update_traces(textfont_color='green', marker_color='blue', width=0.7) 추가하여
막대 조절, 텍스트 색상 바꾸기 완성(정렬은 기본?)
import plotly.express as px

fig = px.bar(count_by_subject, x=count_by_subject.index, y=count_by_subject.values, text=count_by_subject.values)
fig.update_layout(title='Book of subject', xaxis_title='subject', yaxis_title='number of books', width=660, template='seaborn')
fig.update_layout(
                 title_x = 0.5,
                 title_y = 0.9,
                 title_xanchor = "center",
                 title_yanchor = "middle")
fig.update_traces(texttemplate='%{text:.2s}', textposition='outside', textfont_color='green', marker_color='blue', width=0.7)
fig.show()